Search This Blog

Monday, September 23, 2013

Updated Dow30, Dow3000, and Dow65 Symbol Lists Available

Updated Dow30, Dow3000, and Dow65 Symbol Lists are now available to download from our website under Support > File Downloads. http://www.taquote.com/support/download.html

Formatted ListsFile NameSize
  • Dow Jones 30 Industrials Index + S500 (09-23-13)

  • Dow_3000.lst3 K
  • Dow Jones 30 Industrials (09-23-13)

  • Dow30.lst2 K
  • Dow Jones Composite (09-23-13)

  • Dow65.lst6 K

    Monday, September 16, 2013

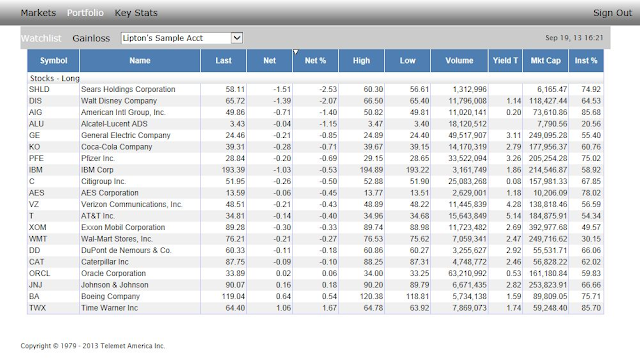
    Telemet releases Mobile Web App

    Telemet is proud to announce the release of a mobile web app that can be used from any computer, tablet, or mobile device to view real-time quotes, research, and gain/loss information on your Telemet Orion lists and portfolios!

    Our web app is browser based and works with Androids, iPhones, iPads, Macs - any device that has access to the internet. 

    Call or email our Support team today for more information: 800-368-2078 or support@taquote.com


    Monday, August 26, 2013

    Telemet releases version 8.2.03.02 with Internationals Data and Excel Telemet IQ 64 Add-In

    Telemet has released version 8.2.03.02 which incorporates end-of-day Internationals Data as well as compatibility for our Telemet IQ add-in with Microsoft Excel 64 bit.  Additional enhancements include: custom quintile ranges in Multi-Style Attribution, the ability to view the earnings conference call calendar for your list of companies, and new multiple color options showing price direction for charts.
     
     
    Call or email Telemet's Client Services team with any questions: 800-368-2078 or support@taquote.com

    Monday, August 19, 2013

    Additional Data for SPX

    Additional data is now available for the S&P 500 Index, sectors, and industries: 
    • EPS Growth 5 yr
    • Beta
    • Earnings Stability 5 yr
    • S&P P/E Estimate Next FY
    

    Friday, August 2, 2013

    Data Columns Added for Adjusted PE and PEG

     
    The following custom columns are now available:

    In the Earnings folder
    • PE Adjusted - Prior FY
    • PE Adjusted - Year Ago
    • PE Adjusted - End LFYr
    • PE Adjusted - End Last Q
    • PE Adjusted - End Nxt Last Q
    • PE Adjusted - End 3Q Back
    • PE Adjusted - 5 yr High
    • PE Adjusted - 5 yr Low

    In the Zacks folder
    • Zacks PEG Adjusted Yr Ago
    • Zacks PEG Adjusted LFY
    • Zacks PEG Adjusted End Last Q
    • Zacks PEG Adjusted End Nxt Last Q
    • Zacks PEG Adjusted End 3Q Back
    • Zacks PEG Adjusted 5 yr Hi
    • Zacks PEG Adjusted 5yr Low
    • Zacks Q3 Earnings Estimate, Zacks Q4 Earnings Estimate, Zacks P/E Forward 4Q are now showing data for Russell indexes, S&P 500 and sectors & industries.

    In the S&P folder
    • S&P PEG Adjusted End LFYr
    • S&P PEG Adjusted Yr Ago
    • S&P PEG Adjusted End Last Q
    • S&P PEG Adjusted End Nxt Last Q
    • S&P PEG Adjusted End 3Q Back
    • S&P PEG Adjusted 5 yr Hi
    • S&P PEG Adjusted 5 yr Low


      Thursday, May 2, 2013

      New historical chart financials indicators

      New financial indicators for historical charts have been added for Standard and Poors Valuation Estimates! 
       
      • Trailing 4Q EPS Estimate
      • Trailing 4Q EPS Adjusted Estimate
      • Foward P/E Trailing Twelve Months
      • Forward P/E Adjusted Trailing Twelve Months


      The indicators represent weekly (on Fridays) history of NTM (next twelve months) historical data of  the S&P Estimates fields EPS (GAAP) Consensus Mean and EPS Normalized Consensus Mean and their corresponding Forward P/E rates. Standard and Poor’s provides various periods marked as NTM with each consensus. We select those closest to one year from consensus date.
      Monday, April 15, 2013

      New Earnings and Dividend data columns available!

      We have added the following new columns of data!

      - Zacks P/E Forward 4Q* – calculated from last price and sum of 4 quarters estimates

      - Date – Announced (in Dividend group) – date of last company dividend announcement from dividend table

      - % Earnings Clarity (in Earnings group) – percentage rate of sum of EPS for last 3 years to sum of adjusted EPS for same period

      - Earnings Write Off (in Earnings group) – percentage rate of sum of difference between EPS and adjusted EPS for 3 years to sum of adjusted EPS for same period


      *Zacks Estimates data available to subscribers of Zacks Consensus Earnings Estimates

      Tuesday, April 2, 2013

      New Data Columns Added

      The following new custom columns are now available:


      Column Grouping                         Data Field

      Financial Ratios                            Debt / Capital
      Statistical                                      Capture Ratio 1y
      Statistical                                      Capture Ratio 3y
      Statistical                                      Capture Ratio 5y
      Statistical                                      Capture Ratio 10y
      Statistical                                      Capture Ratio 15y
      S&P Estimates                             S&P P/E Forward 4Q

      Tuesday, March 26, 2013

      Even more Crack Spread Futures Added!

      The below crack spread futures have been added to Telemet Orion:
       
       
      • BBXX 3.5% Fuel Oil Barges FOB Rdam (Platts) CS (1000mt)
      • EAXX European Naphtha (Platts) Crack Spread BALMO
      • EOXX Argus Gasoline Eurobob Oxy Barges NWE CS (1000mt)
      • FVXX 1.0% Fuel Oil Cargoes FOB NWE (Platts) CS (1000mt)
      • GEXX Gasoline Euro-bob Oxy NWE Barges (Argus) CS BALMO
      • GKXX Gasoline 10 ppm FOB MED (Platts) Crack Spread
      • GOXX Gasoil Crack Spread (1000mt) Financial Futures
      • KSXX Singapore Jet Kerosene (Platts) Dubai (Platts) CS
      • MLXX New York Harbor Residual Fuel (Platts) CS Futures
      • NOXX Naphtha Cargoes CIF NWE (Platts) CS (1000mt) F
      • SBXX Singapore Fuel Oil 180 cst (Platts) Brent CS F
      • SDXX Singapore Mogas 92 Unleaded (Platts) Dubai
      • SGXX Singapore Fuel Oil 380 cst (Platts) 6.35 Dubai CS
      • SRXX Singapore Fuel Oil 180 cst (Platts) 6.35 Brent CS
      • STXX Singapore Fuel Oil 180 cst (Platts) 6.35 Dubai CS


      Thursday, March 14, 2013

      New Futures Data Added!

      The following crack spread futures have been added to the Telemet Orion platform:


      • FOXX 3.5% Fuel Oil Barges FOB Rdam (Platts) Crack Spread Futures
      • GYXX Gulf Coast ULSD (Platts) Crack Spread Futures
      • GZXX European Gasoil Brent Crack Spread Futures
      • ENXX European Naphtha (Platts) Crack Spread Futures
      • HKXX Heating Oil Crack Spread Futures
      • FIXX 1% Fuel Oil Cargoes FOB NWE (Platts) Crack Spread Futures
      • MGXX Gulf Coast No. 6 Fuel Oil (Platts) Crack Spread Futures
      • OBXX Heating Oil Brent Crack Spread Futures
      • RUXX Gulf Coast Unl 87 Gasoline M1 (Platts) Crack Spread Futures
      • DNXX Singapore Mogas 92 Unleaded (Platts) Brent Crack Spread Futures
      • GFXX Gulf Coast No.6 Fuel Oil 3.0% (Platts) Brent Crack Spread Futures
      • RCXX RBOB Gasoline Crack Spread Futures
      • TKXX Gasoline Euro-bob Oxy NWE Barges (Argus) Crack Spread Futures
      • GBXX RBOB Gasoline Brent Crack Spread Futures


      Thursday, February 28, 2013

      Short Interest Data Now Available!

      The below Short Interest columns of data are now available for all Real Time NASDAQ subscribers and can be found in the Statistics column grouping.
       
       
      • Short Interest
      • Days to Cover
      • Short Interest Prior Mo
      • Short Interest % Float

      Thursday, February 21, 2013

      Additional S&P Price to Earnings Ratios Added!

      S&P index, sectors, and industries coverage was added for the below columns and can be found in the Financial Ratios column group.
       

      • P / Earnings Curr FY Avg 5Y High
      • P / Earnings Curr FY Avg 5Y Low
      • P / Earnings Curr FY Avg 5Y Avg 

      Wednesday, February 20, 2013

      NEW Capital Expenditure S&P Estimates Available

      New columns for S&P Capital Expenditures Estimates are now available for all S&P Estimates Plus subscribers.
       
      • S&P Capital Expenditure Est Mean FY
      • S&P Capital Expenditure Est Mean FY2
      • S&P Capital Expenditure Est Mean FY3
      • S&P Capital Expenditure Est Mean FY4
      • S&P Capital Expenditure Est Mean Q
      • S&P Capital Expenditure Est Mean Q2
      • S&P Capital Expenditure Est Mean Q3
      • S&P Capital Expenditure Est Mean Q4
      • S&P Capital Expenditure Est Mean Q5
       
      For a complimentary trial of S&P Estimates, please call or email client services at 1-800-368-2078 or support@taquote.com


      Wednesday, January 23, 2013

      3,203 new Dow Jones Indices Added!

      3,203 new Dow Jones Indices have been added for all Telemet Orion subscribers!  Below is just a sampling of the new data.

      A1SUSDJ Sustainability North America Index ex Alcohol, Tobacco, Gambling, Armaments & Firearms
      A1SUSEDJ Sustainability North America Index ex Alcohol, Tobacco, Gambling, Armaments & Firearms (EUR)
      A1SUSETRDJ Sustainability North America Total Return Index ex Alcohol, Tobacco, Gambling, Armaments & Firearms (EUR)
      A1SUSNTDJ Sustainability North America NET Total Return Index ex Alcohol, Tobacco, Gambling, Armaments & Firearms (USD)
      AASUSTRDJ Sustainability U.S. Total Return Index ex Alcohol, Tobacco, Gambling, Armaments & Firearms
      AB100MOMAlphaBeta Tel-Aviv Large-Cap Momentum Index
      AB100MOTAlphaBeta Tel-Aviv Large-Cap Momentum Total Return Index
      AB100VALAlphaBeta Tel-Aviv Large-Cap Value Index
      AB100VATAlphaBeta Tel-Aviv Large-Cap Value Total Return Index
      ABGENFNDAlphaBeta Tel-Aviv Broad-Market Fundamental Index
      ABGENFNTAlphaBeta Tel-Aviv Broad-Market Fundamental Total Return Index
      ADOWThe Asia Dow (USD)
      ADOWAThe Asia Dow (AUD)
      ADOWATThe Asia Dow Total Return (AUD)
      ADOWDThe Asia Dow Total Return (USD)
      ADOWEThe Asia Dow (EUR)
      ADOWJThe Asia Dow (JPY)
      ADOWJTThe Asia Dow Total Return (JPY)
      AUDOWDDJ Australia Index (USD)
      B15BDRDDJ BRIC Brazil 15 DR Index
      B15BDRTDJ BRIC Brazil 15 DR Total Return Index
      B15CDRDDJ BRIC China 15 DR Index (USD)
      B15CDRDTDJ BRIC China 15 DR Total Return Index (USD)
      B15IDRDDJ BRIC India 15 DR Index (USD)
      B400TBarrons 400 Total Return Index
      B50ADRDDJ BRIC 50 All DR Index (USD)
      B50ADREDJ BRIC 50 All DR Index (EUR)
      B50ADRRDJ BRIC 50 All DR Total Return Index (EUR)
      B50CNTDJ BRIC China 15 Total Return Index (USD)
      B50DRDDJ BRIC 50 DR Index (USD)
      B50DREDJ BRIC 50 DR Index (EUR)
      B50DRRDJ BRIC 50 DR Total Return Index (EUR)
      B50RUTDJ BRIC Russia 5 Total Return Index (USD)
      B5RDRDDJ BRIC Russia 5 DR Index (USD)
      B5RDRDTDJ BRIC Russia 5 DR Total Return Index (USD)


      Thursday, January 17, 2013

      Capital Expenditures Estimates Now Available!

      Telemet is pleased to announce that clients subscribing to S&P Estimates Plus will now receive fiscal year and quarterly CapEx estimates.

      To view them, choose Display>Research>Earnings Estimates>S&P Estimates. The Capital Expenditures Consensus figures can be found under the Consensus Trend tab.


      Call or email the client services team for a complimentary trial! support@taquote.com 1-800-368-2078